Acquire & Record
The acquisition workflow: start the camera, frame the region of interest, tune processing while watching the preview and monitoring charts, then record an experiment to HDF5.
Start the camera
Click Start Live View (main tab-bar corner). Frames start streaming from the connected camera (or the mock folder) and the status-bar statistics come alive. Stop Camera halts acquisition; statistics reset to zero. Both buttons, and the Space bar over the preview, go through one guarded command path: while an experiment is running or its data is being saved, every way of stopping the camera is refused with the same message until the experiment is stopped. A camera that fails to open or disconnects shows the backend's reason in the status bar and offers Start Live View again.
Overview tab — frame the ROI
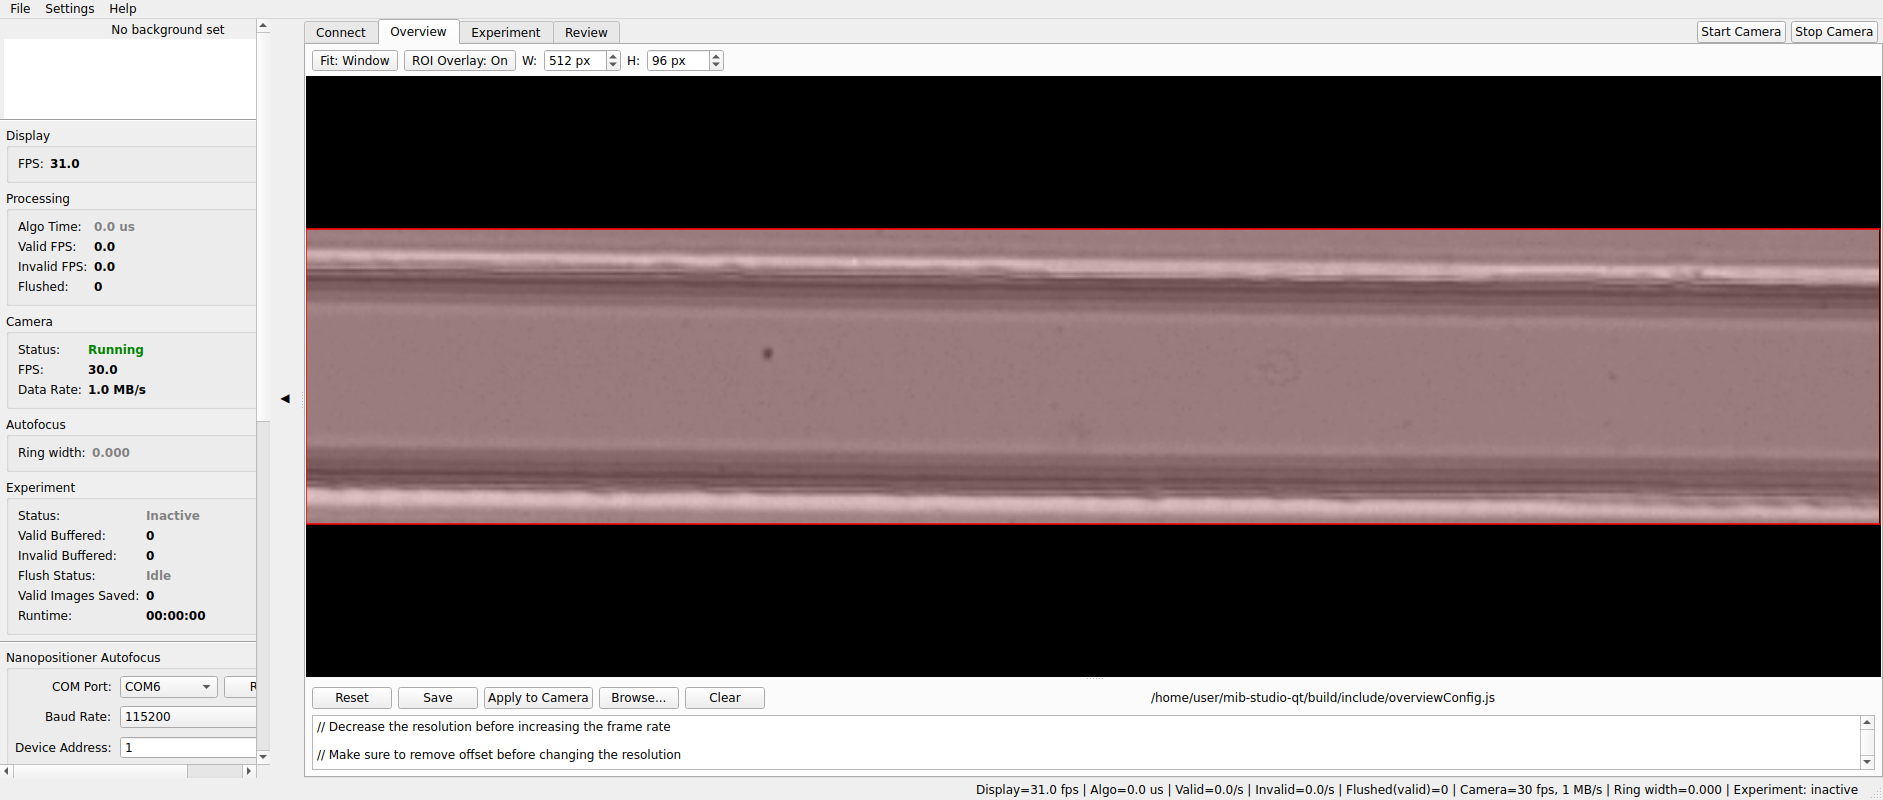
- Shows the raw live stream (display rate capped independently of the camera rate, so a fast camera does not overload the UI).
- The semi-transparent red rectangle is the region of interest (ROI):
drag it to reposition. The ROI feeds processing and recording directly,
and the current geometry is echoed in the status bar
(
ROI: w x h @ (x, y)). - Advanced: the tab hosts the camera-side GenICam script editor. Apply to Camera stops capture while the script is applied — restart the camera afterwards.
Wafer Grid — locate the chip
Wafer Grid reads the wafer's dot-grid fiducials in the live image to identify the chip design, the chip (die), and the absolute wafer position. It is an alignment aid on Overview, separate from cell processing.
- Start Live View and keep Overview visible.
- Click Wafer Grid: Off beside the ROI controls. The button changes to Wafer Grid: On. Click it again to turn localization off.
- Bring a region containing several rows and columns of fiducial dots into clear focus. Localization samples the latest frame periodically (by default every 250 ms), rather than decoding every camera frame.
When localization succeeds, orange circles mark detected dots and a cyan cross marks the image centre. The text shows Wafer X and Y in µm at that centre, rotation θ in degrees, measured µm/px, direct or mirrored orientation, the design name and, when the centre falls within a registered chip boundary, chip followed by its name. The last line gives the dot count, votes and decoding time in ms. These are mask coordinates; the bundled Wafer_soRT mask is enlarged by 1.5%.
The bundled design registry recognises Wafer_soRT DC sorting chip
(30 um channels), revision 2025-03-16 (wafer-sort-rt), with a 30 µm
dot pitch. Recognition requires that design's encoded fiducial pattern;
an arbitrary dot grid or an unregistered chip design is not enough. A
locally installed design registry can add designs. There is no design
selector in the Overview toolbar; recognition uses the configured registry.
If it does not lock:
- Wafer grid: waiting for a frame — check that Live View is running and Overview is visible.
- too few dots or no consistent code window — move away from ports or a channel-only view to an area with more fiducials. Check focus, illumination and the pixel-to-micrometre calibration used for detection.
- too many blobs, lattice fit failed or bit agreement too low — improve the dot image and check that the wafer matches an installed design.
- ambiguous code windows or ambiguous design (...) — no position is accepted; try another fiducial area. If it persists, ask the instrument maintainer to check the design registry.
- Dot-grid localization is not available: … — the toggle was rejected; use the reason in the dialog when reporting the problem.
An unsuccessful decode shows the reason and dot count in red text, without valid dot/centre markers. Localization pauses when Overview is hidden, including when you switch to Experiment. It does not decode alongside experiments, even if Wafer Grid: On remains selected; returning to Overview resumes localization. Overview is unavailable while an experiment is active; stop the experiment before returning to alignment.
Illuminated Live View — MindVision camera and LED strobe
This workflow is for a connected MindVision camera with an XGC + R5D rig: a pulse generator connected through RS485 supplies the camera's external trigger, and the camera's OUT1 strobe drives the LED. The camera, generator and LED driver must be connected and powered, with the configured generator channel wired to the camera trigger input. Software discovery cannot check that wiring or determine which channel you connected.
Start and stop
- Select the MindVision camera on Connect if it was not selected automatically. The bundled profile enables illuminated Live View and automatically looks for one compatible generator at address 1, using 9600 baud, 8 data bits, no parity, 1 stop bit, and channel 1.
- On Overview, click Start Live View. Connecting the camera or arriving on Overview does not start illumination. Start applies the saved camera setup, arms the strobe, then enables the generator's trigger train. No separate generator Connect, Set or Start, or Apply to Camera, is needed for the illuminated profile.
- Click Stop Camera to stop Live View. Stop gates off the trigger train and drives the camera's OUT1 low to turn the LED off before releasing capture. Failed starts also use illumination cleanup.
If Stop reports that generator or LED OFF was not confirmed, check the connections and use the generator Stop in Advanced — Hardware Setup as directed by the error. Do not treat that message as confirmation that the LED is dark. During an experiment, stop the experiment before stopping capture, as described above.
Overview uses the full sensor at a requested 400 Hz trigger rate, with display refresh capped at 50 fps. Switching to Experiment uses the selected ROI and saved experiment trigger rate. Switching between those tabs while live stops, reconfigures and resumes capture; switching while stopped leaves capture stopped. Requested trigger rate and measured camera FPS are different values.
Save a preset or adjust exposure
Open Experiment ▸ Preview, choose Settings: Expanded if needed, and select Camera trigger & strobe (MindVision) in the configuration inspector. Exposure (µs), Requested FPS and Save are available without opening the advanced controls.
For a custom connection, stop Live View, expand Advanced — Hardware Setup, and select Port, Baud, data bits, parity, stop bits, Addr and Ch in Pulse generator (external trigger source, RS485). Click Use XGC + R5D preset for Live View. This saves the selected connection and channel; it does not start hardware.
That preset saves a 512×96 ROI, 2: External trigger with Rising edge, one frame per trigger, zero trigger delay and jitter, and a 1000 Hz trigger train at 2% duty (a 20 µs camera-trigger pulse). The strobe is 1: Semi-auto (delay+width), Width (µs) 100, Delay (µs) 0, Active low. The LED strobe width is separate from the generator's camera-trigger pulse width.
The preset button saves 100 µs exposure; the bundled default profile uses 2 µs exposure, with the same 100 µs strobe. Custom saved profiles retain their own values. To adjust Exposure (µs) or Requested FPS, stop Live View, edit the value, click Save, then Start Live View. Unsaved edits are not applied at Start. Save stages the next start without operating hardware. Changing Requested FPS preserves the requested camera trigger pulse duration by adjusting duty; it does not change exposure or strobe width/delay. The FPS control is disabled for manual profiles.
Troubleshooting illuminated Live View
- No generator found or more than one matches — check generator power, the serial adapter and address. For a custom or ambiguous rig, select the correct port and connection settings in Hardware Setup and save the preset. Automatic discovery requires exactly one compatible generator.
- Save refuses the timing — exposure and strobe delay plus width must fit the trigger period: exposure may equal it, but strobe delay plus width must be shorter. Reduce Requested FPS or correct the timing values reported by Save, then save again.
- Start fails or frames stop arriving — read the status-bar reason and check camera access, trigger wiring, generator and strobe connections. Camera-setting/readback failures prevent startup; acquisition faults shut down illuminated capture.
- Image too bright or too dark — stop, adjust Exposure and Save, then restart. Check the LED driver and optical setup as well. A requested strobe width describes the command, not a measurement of LED current.
- Camera FPS differs from Requested FPS — the camera and ROI determine the achievable rate; the generator's 400–40000 Hz setting range does not guarantee that acquisition rate. Overview deliberately uses 400 Hz.
Experiment ▸ Preview — tune processing
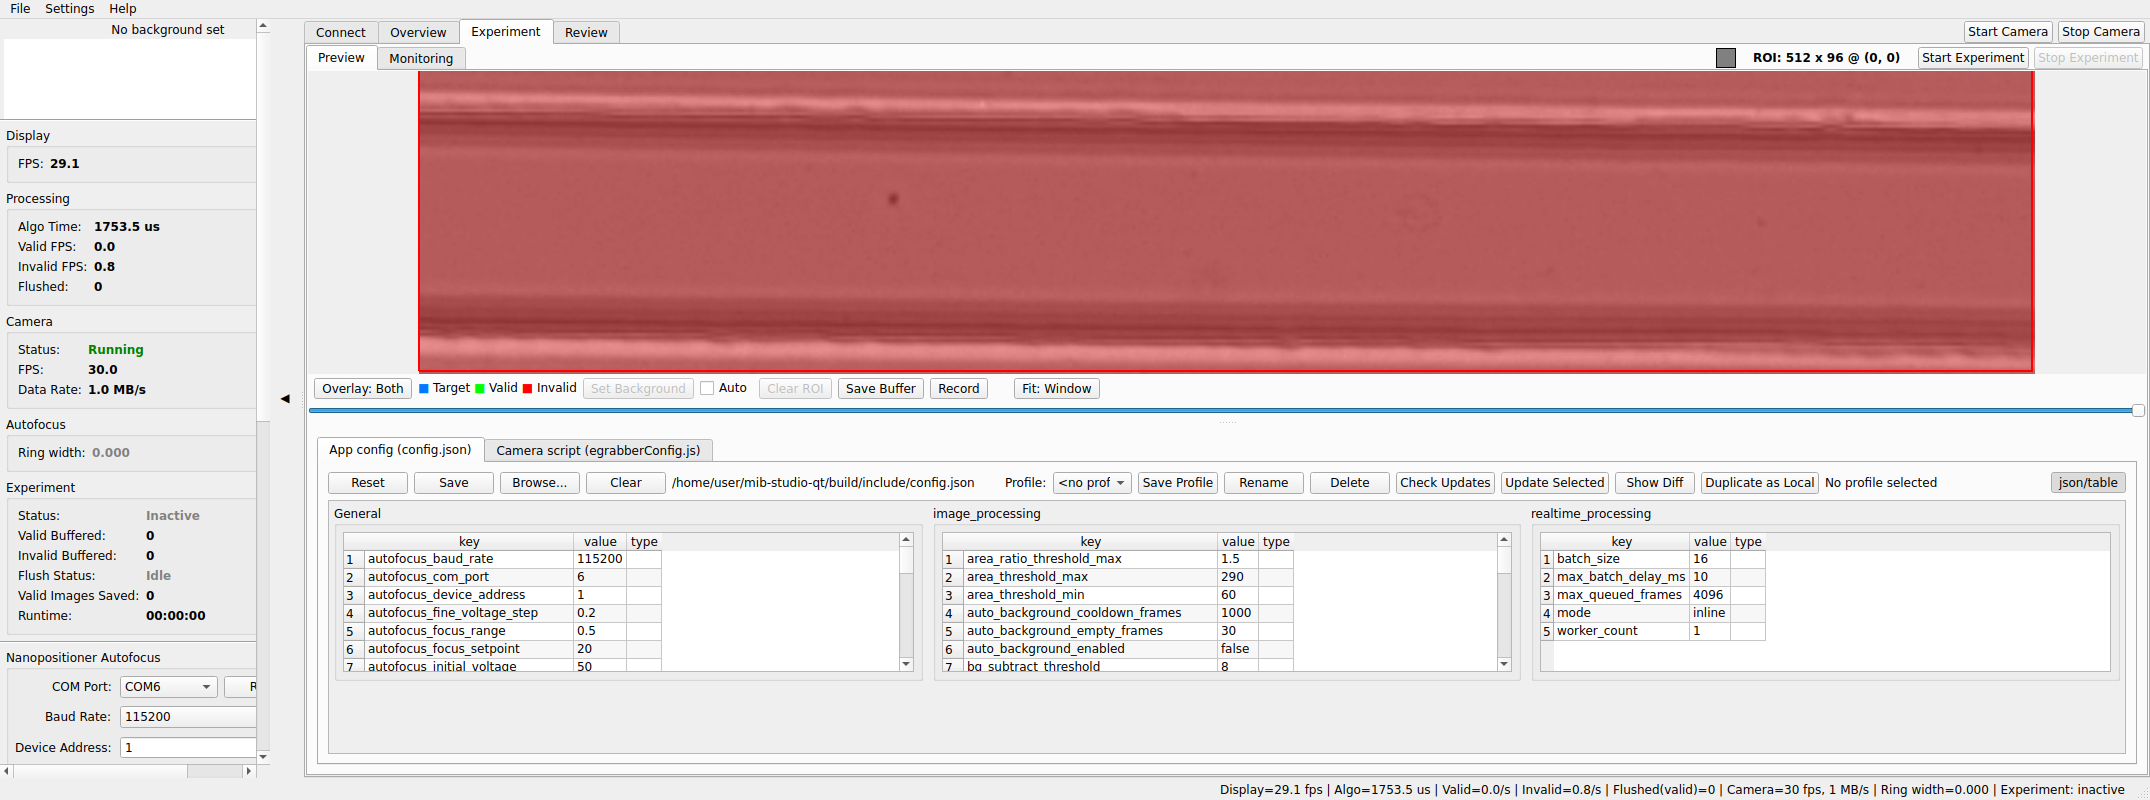
- The canvas shows the processed view. Overlay modes: Off / Mask / Contours / Both. While following live, cell colors mean blue = target group, green = valid, red = invalid.
- Playback controls under the canvas let you pause and scrub the recent frame buffer; save buffer to disk exports it as a single uncompressed AVI (ImageJ/Fiji-compatible) or a folder of TIFFs, never overwriting existing output.
- A background frame is captured automatically (or set manually from the playback panel); the current background shows in the sidebar preview.
- The configuration inspector below the image edits the processing
configuration — thresholds, gates, multi-image, target group — and
manages named profiles, including catalog-published ones. Its header
shows the active Profile, its state (Loaded, Edited (unsaved),
Saved, Conflict), Reset, Save, and a More… menu with the
profile-management actions (save as / rename / delete / duplicate,
catalog updates and diff, choosing another config file, table view).
Notices below the header explain unsaved edits, a file that changed
elsewhere while you were editing (your edits are kept until you choose
Reset or Save), a failed save, or an incompatible profile. The
Settings: Expanded / Compact / Hidden bar at the bottom of the page
sizes the inspector — Compact keeps only the profile/state header so
the live image dominates during alignment — and the app remembers your
choice and the divider position. Changes saved
to the config file apply live; no restart needed. Note that several gates
only take effect when their
enable_*flag is on.
Experiment ▸ Monitoring — watch the numbers
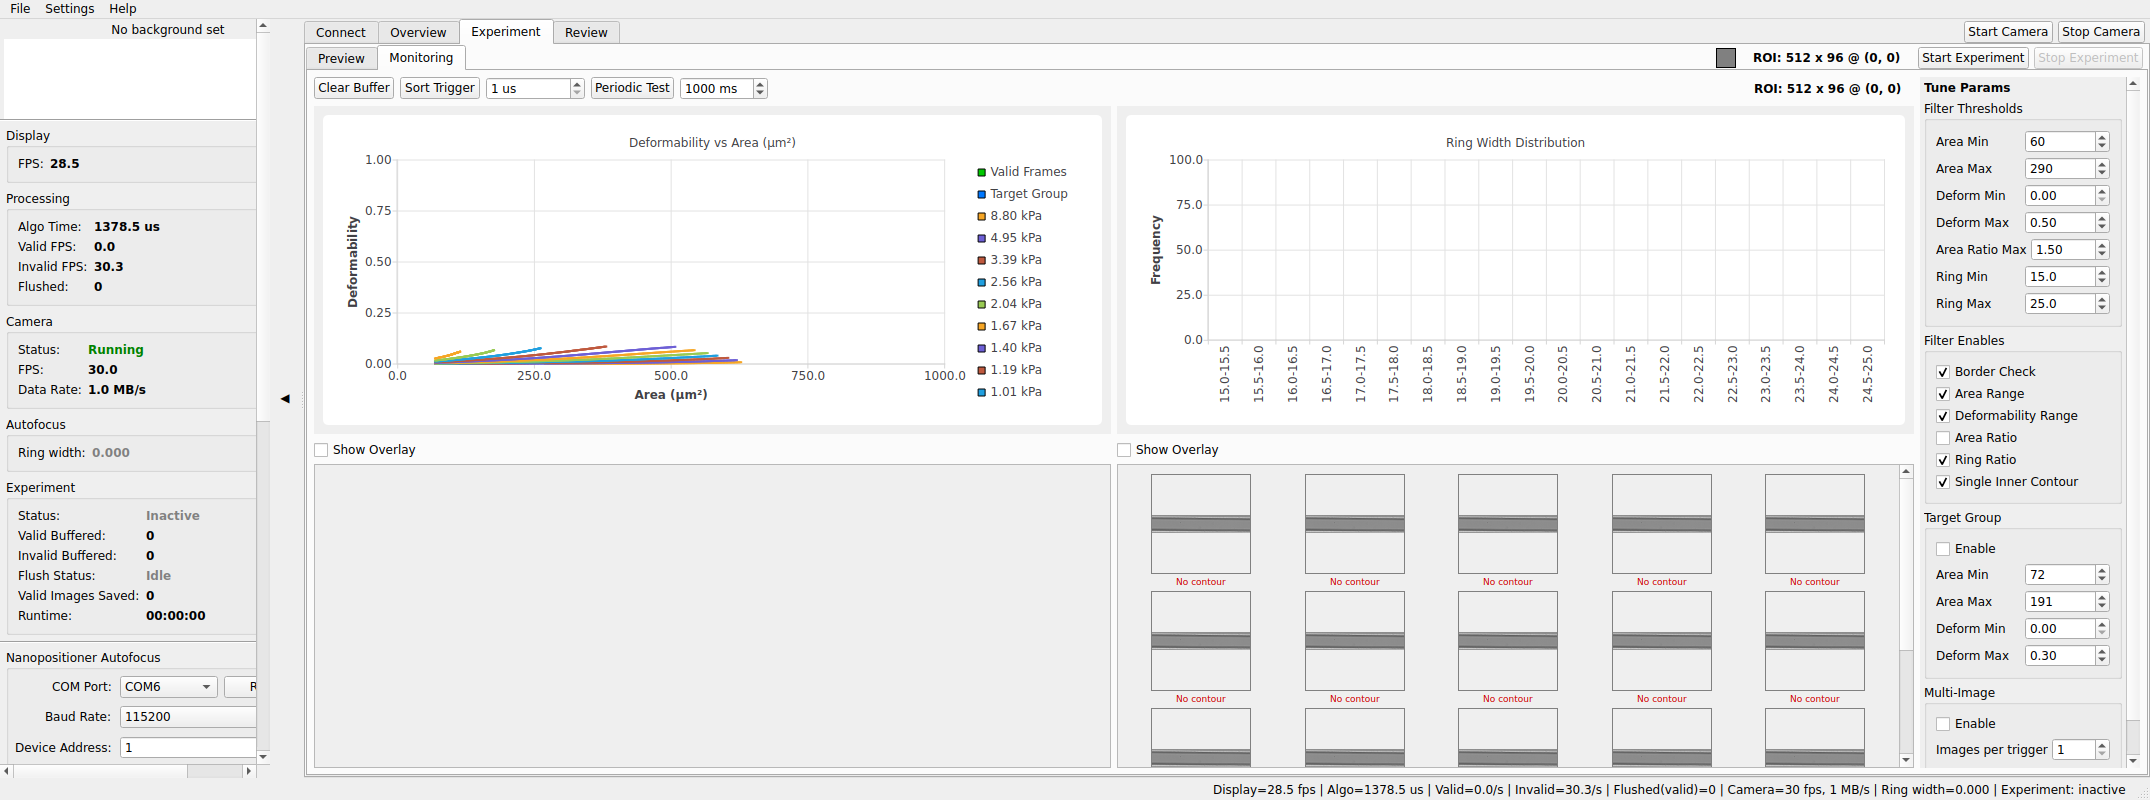
- Live histograms (area, deformability, brightness) and scatter plots (e.g. deformability vs. area) over the most recent frames, with scroll-to-zoom.
- Density (KDE) in the top row colours every point of the deformability-vs-area scatter by how crowded its neighbourhood is: light blue for isolated cells, dark blue for the core of the population, the same pseudocolour view as a cytometry dot plot. The estimate is recomputed every 2 s (adjustable) in the background, so the chart never stalls; cells that arrived since the last estimate show in the lightest shade until the next one. While the toggle is on, target-group cells are drawn as squares instead of circles so they remain identifiable. Hover the toggle to see how many points the last estimate covered and how long it took. The setting is remembered between sessions.
- Core contour. With Density on, a solid blue line encloses the densest 90% of the cells (the share is adjustable under Settings ▸ Monitoring Settings ▸ Core contour). A bimodal population shows one loop per cluster. To compare against an earlier state, Pin current in the same dialog keeps that contour on the chart as a dashed orange line; From file… takes the contour stored in a previous experiment instead (and is remembered across restarts); Clear removes it. A drift of the solid line away from the dashed one is the population shift.
- When Density is on during an experiment, the contour on screen at Stop is saved into the experiment file as a provisional core contour. It covers the most recent cells shown on the chart, not the whole run; the Review tab draws it dashed on that experiment's scatter.
- Live totals: valid count, invalid count, algorithm FPS, valid FPS.
- Charts accumulate only while the tab is visible, and they are a live preview — they are not saved with the experiment.
- The top row also carries trigger bring-up controls (single and periodic test pulses) for commissioning a sorter.
Tune panel
The panel on the right edits the acceptance criteria without leaving the page. Each criterion is one box with its own enable checkbox in the title and its values below it, named in full with units:
| Group | Criteria |
|---|---|
| Cell acceptance filters | Area (µm²) min/max · Deformability min/max · Ring ratio min/max · Area ratio max · Border exclusion · Single inner contour |
| Target group / sorting gate | Area (µm²) min/max · Deformability min/max — applied to valid cells only; selects which fire the sort trigger and never changes validity |
| Multi-image acquisition | Record image series · Images per trigger |
Unchecking a criterion greys out its values but keeps them visible, so you can see what it would use when re-enabled.
Editing a value only changes the panel: the footer under the list reads
N unapplied changes, changed rows are marked with *, and nothing is
applied yet. Apply changes writes exactly those fields into the active
configuration file and applies them to processing; the footer returns to
Applied only once both have been confirmed. If the write fails the panel
stays dirty and says why. Revert discards the edits and reloads the
current configuration. The footer and its buttons never scroll out of
view. Impossible ranges (minimum above maximum) are flagged under the
state text and block Apply.
If the configuration changes elsewhere (a profile switch, an edit in the Preview inspector or an external editor) while you have unapplied edits, the footer shows Conflict and an alert appears; your edits are kept until you click Revert to load the new values.
Settings dialogs
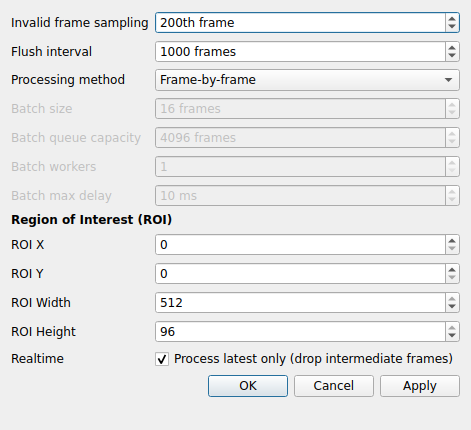
Settings ▸ Processing Settings — the full processing configuration form: blur/threshold, validity gates, ring-ratio and target-group gating, multi-image capture.
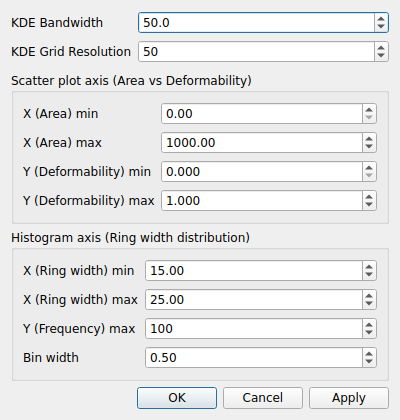
Settings ▸ Monitoring Settings — the Monitoring page's fixed axis ranges, histogram bin width, and the two density (KDE) controls: the bandwidth factor (1 = automatic per-axis bandwidth; above 1 smooths the colouring, below 1 shows finer structure) and the update interval between density estimates.
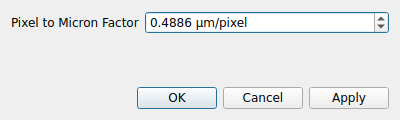
Settings ▸ Pixel-to-Micron — the pixel→micrometre conversion factor (default 0.4886 µm/px) used for area and derived metrics.
Record an experiment
- Make sure the camera is running (Start Live View). Start runs a readiness check first: if anything blocks it — camera not running, a requested hardware camera that fell back to the simulated one, the pinned processing core not active, no free space at the destination, an unacknowledged save fault from the previous run — a dialog lists each blocked check with what to do about it. Warnings (no background image, simulated camera, Latest Frame delivery) do not block.
- Click Start Experiment (Experiment tab-bar corner). A Save dialog
asks where to write the HDF5 file (
.h5is appended if you omit it). The app freezes the run's configuration (camera, ROI, processing core, configuration revision, background, calibration factor) into the file before the first frame; if the configuration changes between the check and the start, the start is refused and you simply start again. The run state in the Experiment tab-bar corner reads Running (with the file name in its tooltip) and the flushed-frame counter starts. - Click Stop Experiment when done. The run state goes through Stopping and Saving while the final flush and the metadata (ROI, background, configuration) are written in the background, then Complete — wait for Complete before pulling a USB drive. If any part of the save fails the state stays Failed – recovery required and an alert explains what to do; the next Start is blocked until the fault is acknowledged in the readiness dialog.
The run state is always written as text (Idle, Camera running, Starting, Running, Stopping, Saving, Complete, Failed); the color is only a hint.
Recorded files contain the valid/invalid frame images, masks, per-frame metrics, and the experiment metadata needed to reanalyse later — see Review & post-process.
Status bar, alerts and diagnostics
The status bar shows one compact line of live metrics on the left (Camera fps · Valid/Invalid rates per second · Algo time · Run time and buffered frames while recording), the Diagnostics… button, and the processing-core and acquisition-mode badges on the right. The full statistics (display FPS, flushed totals, camera data rate, ring width, buffer state) stay in the hardware panel on the left of the window.
| Field | Meaning |
|---|---|
| Display | Frames per second actually rendered in the preview |
| Algo | Realtime processing time per frame (µs) |
| Valid / Invalid | Classification rates per second |
| Flushed | Total valid frames written to HDF5 in the active experiment |
| Camera | Transport statistics from the camera (frame rate, MB/s) |
| Ring width | Median ring ratio of validated frames (drives autofocus) |
Rates reset to zero when an experiment starts or capture stops; totals persist until the next experiment starts. A value shown as n/a was not reported by the camera; it is never displayed as 0.
Alerts. Warnings and errors that need your attention (a failed camera start, a save failure, a configuration file changed on disk while you were editing it) appear in a banner above the tabs with the reason and what to do. Repeats of the same problem are counted on one line, Details lists every open alert, and Acknowledge hides the banner — it does not clear the underlying condition; that clears when the cause is fixed. Metrics updates never remove an alert.
Diagnostics… (status bar or Help ▸ Diagnostics…) opens a non-modal window with the detailed values that used to crowd the status bar: capture session state, requested vs confirmed delivery mode, transport counters (delivered, lost, discarded, underruns, queue depths), frame age and publish latency, the timestamp source, the active processing core and its artifact hash, and process memory. It refreshes on every statistics tick while open.
Below those values the dialog lists the memory owners: the camera SDK
buffers (estimated from the buffer count, or unknown when the camera
backend cannot report them — never shown as zero), the frame ring, the
experiment buffer, the Monitoring rings, the processing queues and the
presentation snapshot, each with current / peak / budget MB and how many
items the bound evicted. An owner marked OVER has exceeded its declared
budget. The last line separates display counters (frames the preview
rendered or skipped because it draws at a capped rate) from real losses:
skipping a frame on screen never affects what was processed or recorded.
The experiment buffer's byte budget can be set per profile with the
experiment_buffer_max_mb key (default 512 MB).